Conversion Rate Optimization Tools: The 2026 Buying Guide (by Job, Budget, and Traffic)
Every CRO tool list ranks its own product first. This one sorts the tools by job, budget, and traffic level, prices included, and tells you up front what we sell.
Your site gets traffic. The sales don't follow.
So you searched for conversion rate optimization tools, and you found the same page eleven times: a vendor's blog ranking 8 to 35 tools, with the vendor's own product ranked at the top. You already know how that story ends. You buy another subscription, you get another dashboard, and the dashboard tells you where visitors leave without ever telling you why.
Here's our cards-on-the-table version instead. We're Just Digital, a proof-first marketing studio. We sell one of the tools in this guide: Watson, a $9 one-time copy diagnostic. We'll tell you exactly what it does, what it doesn't do, and where every other category of tool fits, sorted by the three things that actually decide the purchase: the job, your budget, and your traffic level.
We also pulled fresh search data for this guide rather than recycling someone's 2023 numbers. In our July 2026 Semrush pull, advertisers pay $15.42 a click for this exact search, while "cro audit" costs $0.00. The money is chasing tools. Almost nobody is paying for diagnosis. That gap is most of this article.
TL;DR
- CRO tools split into two sides: WHERE-tools locate the leak (analytics, heatmaps, session replays, A/B tests) and WHY-tools explain it (buyer research, copy diagnosis). Nearly every stack owns WHERE twice and WHY never.
- You can cover both sides for $9 total: Google Analytics 4 (free) to measure, Microsoft Clarity (free) to watch, and Watson ($9, one time, no subscription) to diagnose the copy.
- A/B testing needs volume most sites don't have. Even at Microsoft, Bing, Booking.com, Netflix and Airbnb, published test success rates run 8% to 33%. Below serious traffic, test-first is a coin flip you can't score.
- Watson reads a page that sells, scores 7 buying triggers, ranks every leak, names the costliest one first (The Prime Suspect), and hands you a report in about 10 minutes.
- Fix the costliest leak first, one change at a time, then re-audit the same page. Then make the traffic yours: an email list survives algorithm updates. Rankings often don't.
What Are Conversion Rate Optimization Tools?
Conversion rate optimization tools are software that raises the share of visitors who act: buy, sign up, book a call. That's the whole category in one sentence.
The useful way to sort them isn't a 25-item ranking. It's two sides of one question.
WHERE-tools locate the leak. Analytics counts who arrived and where they dropped. Heatmaps and session replays show what people clicked, scrolled past, and abandoned. Testing platforms compare version A against version B. All of it answers the same question: where does the money fall out of the page?
WHY-tools explain the leak. Research tools capture what buyers actually think and say. Copy diagnostics score whether the words on the page answer the questions a buyer's brain asks before it says yes. This side answers the question that actually changes your copy: why did they leave?
Almost every guide on page one of Google covers the WHERE side in depth and never mentions the WHY side at all. That's how marketers end up with data everywhere and decisions nowhere.
| Side | Question it answers | Example tool types | What it can never tell you |
|---|---|---|---|
| WHERE | Where do visitors drop off? | Analytics, heatmaps, session replay, A/B testing | Why the page failed to persuade |
| WHY | Why didn't they buy? | Buyer research, voice-of-customer analysis, copy diagnosis | Exactly where in the funnel the loss concentrates |
Here's the same split as a picture, because this one model is most of the guide:
The two-sided model
WHERE-Tools Locate the Leak. WHY-Tools Explain It.
Where · locate
Where does the money fall out?
- Analyticscounts the drop-off
- Heatmaps + replaysshows the behaviour
- A/B testingcompares two guesses
- Surveysasks what happened
Why · explain
Why didn't they buy?
- Buyer researchtheir real words
- Copy diagnosis7 triggers, scored
Watson · $9 one time
Most stacks own the WHERE side twice and the WHY side never.
Framework: Just Digital · justdigital.world
What Jobs Do CRO Tools Actually Do?
Five jobs cover the whole category. Most stacks buy three of them twice and skip the one that changes the words on the page.
Job 1: measure behaviour. Google Analytics 4 (free) tells you where visitors come from, which pages they enter, and where they leave. It's the scoreboard. A scoreboard never explains the score.
Job 2: watch behaviour. Microsoft Clarity (free) records sessions and draws heatmaps. You'll see people hesitate at your pricing table and rage-click a broken button. Useful, and it still can't tell you what the pricing table should say instead.
Job 3: compare variants. A/B testing platforms run structured experiments. They're the right tool once you have both real traffic and a hypothesis worth testing. They cannot generate the hypothesis for you.
Job 4: ask visitors. Survey and voice-of-customer tools collect what buyers say in their own words. Gold when done properly, which takes time and a real research question.
Job 5: diagnose the copy. This is the job missing from the listicles: score the page's persuasion itself. Watson does this for $9: it reads your page the way a buyer's brain does and shows which of 7 buying triggers the page hits and misses.
The WHERE side does matter, to be clear. Google-commissioned research by Deloitte found that a 0.1-second improvement in mobile site speed can lift retail conversions by 8.4% (Milliseconds Make Millions). Speed and measurement are real work. They're just not the whole job.
| Job | Tells you | Can't tell you | Free option | Typical paid range |
|---|---|---|---|---|
| Measure (analytics) | Traffic sources, drop-off pages | Why a page loses the sale | Google Analytics 4 | $0 to enterprise contracts |
| Watch (heatmaps, replay) | Clicks, scrolls, hesitation | What the copy should say | Microsoft Clarity | ~$24 to $249/mo |
| Compare (A/B testing) | Which variant wins | What's worth testing | Rare | ~$99 to $1,581/mo |
| Ask (surveys, VoC) | What visitors say they think | Which page line fails | Basic free tiers | ~$25 to $250/mo |
| Diagnose (copy) | Which buying triggers fail, ranked | Where funnel loss concentrates | Lestrade (intake, free) | Watson: $9 one time |
Paid ranges are aggregated from prices published across the current page-one guides for this search, so you're seeing the market's own numbers, not ours.
There's a sixth thing vendors sell that isn't a job at all: the all-in-one suite. Bundles can be convenient for teams that already know which jobs they need daily. But a bundle bought before diagnosis usually means paying monthly for three jobs you needed once and one job you never needed. Name the job first. Then decide whether it deserves a subscription, a free tool, or nine dollars, once.
Which CRO Tools Should You Buy First?
Start at $9 total, and upgrade only on evidence.
The suites ranked on page one publish prices from $99 to $1,581 a month. Before you sign any of those, run the copy-first CRO audit framework on your own page (it costs nothing to run yourself), then cover all five jobs for nine dollars:
| Layer | Tool | Cost | What it answers | Upgrade trigger |
|---|---|---|---|---|
| Measure | Google Analytics 4 | Free | Where visitors come from and drop off | Outgrowing it is rare |
| Watch | Microsoft Clarity | Free | What visitors do on the page | Need funnels/segments Clarity lacks |
| Diagnose | Watson | $9 one time | Why the page loses sales, leaks ranked | The report itself names your next step |
Full disclosure, again: Watson is ours. So here's what it will not do. It won't fix a broken offer. It won't run your A/B tests. It won't replace analytics. It's not a prompt pack and it's not an AI rewriter. It's the diagnosis step: it scores your page against 7 buying triggers, ranks the leaks by cost, and tells you what to change first. If you run an agency, the same $9 report works as a pre-quote diagnosis on a client's page: rank the leaks before you price the fix.
Why diagnose before subscribing to anything? Because fixing what you already have carries absurd yield. Baymard Institute's benchmarking finds the average large e-commerce site can gain a 35.26% conversion lift through better checkout design alone. Diagnosis-then-fix is not the budget option. It's the high-yield option.
Your buy order by traffic level:
- Under 5,000 visits a month: free WHERE-tools plus Watson. Skip testing platforms entirely; you don't have the volume to call a winner.
- 5,000 to 50,000 visits a month: add one paid tool only when a specific question demands it (a survey tool for a research question, a funnel view Clarity can't draw). One question, one tool.
- Over 50,000 visits a month: now a testing platform can earn its fee, run against the ranked leak list your diagnosis produced, not against guesses.
Ready to Find Your Costliest Leak? Start With Watson
Run it on your homepage and read the ranked list before you shortlist a single subscription.
Why Doesn't Your Stack Tell You WHY Visitors Don't Buy?
A page can pass every analytics check and still fail four buying triggers.
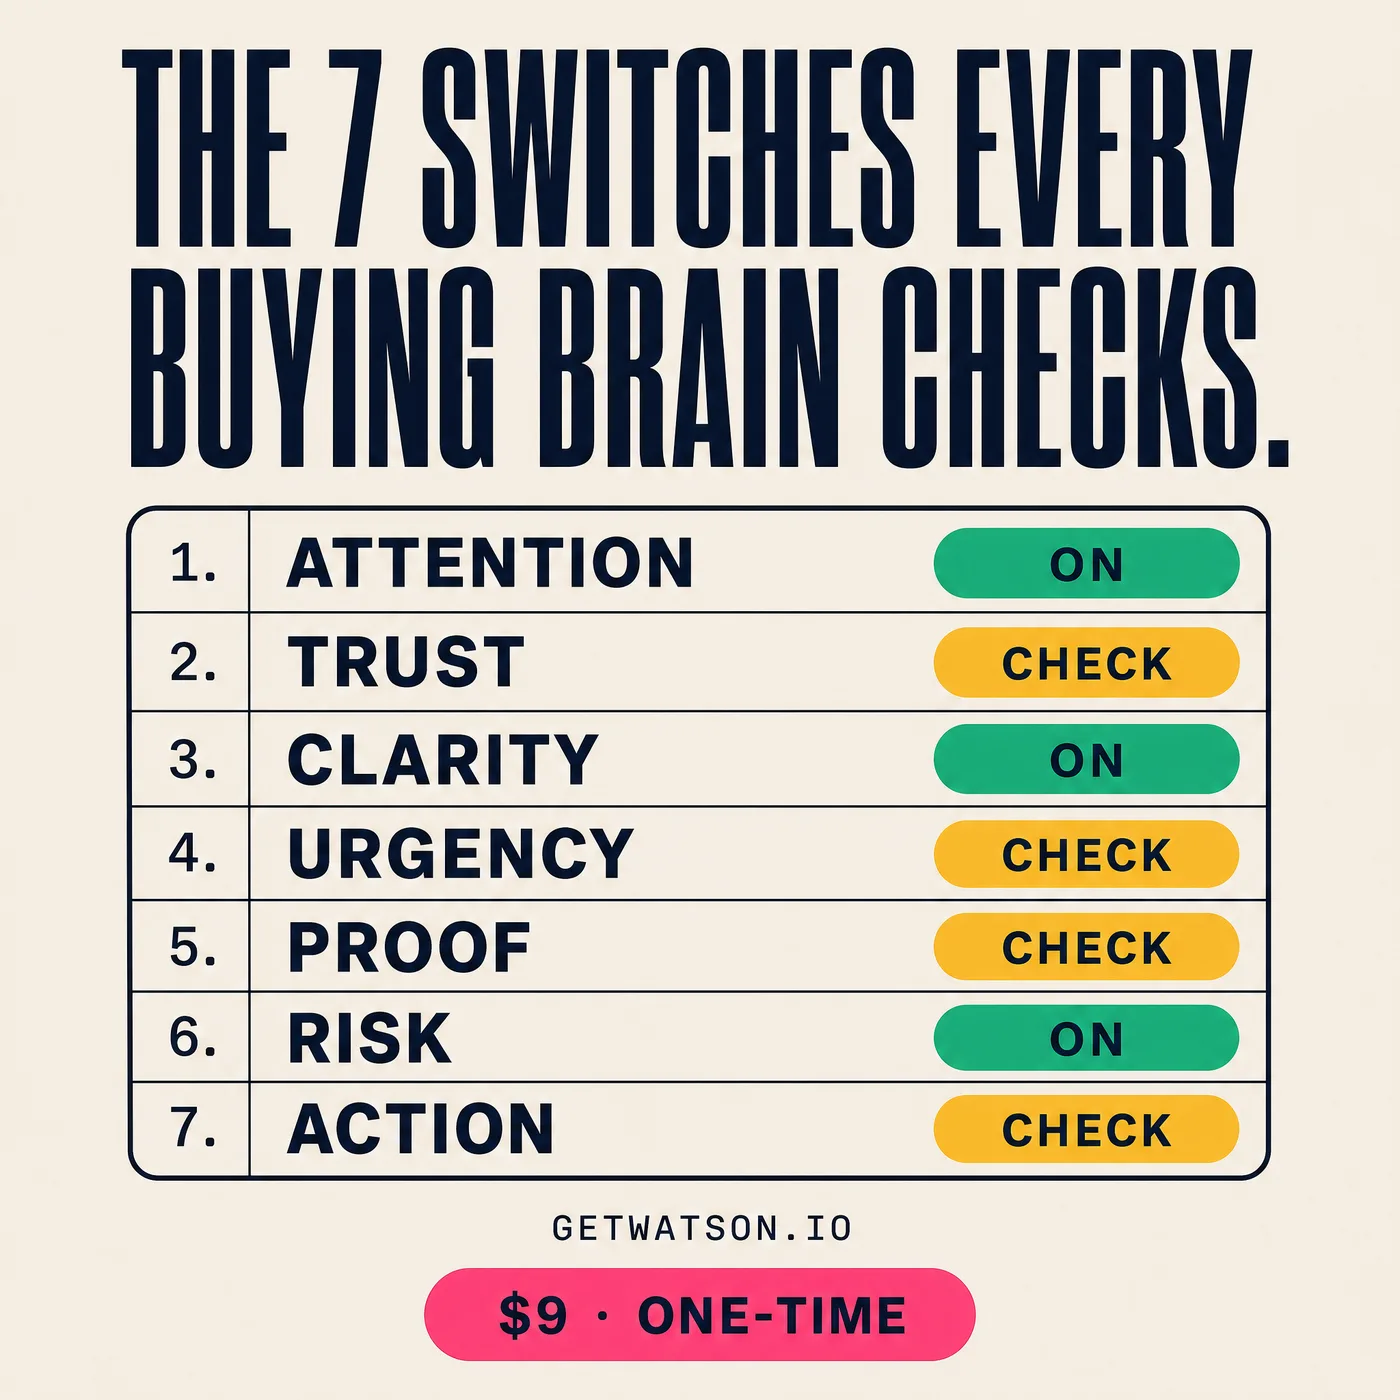
Buying is a psychological sequence. Before anyone pays, their brain runs through fast, unspoken questions: did this catch my attention for the right reason, do I trust this site, is it clear what I get, why now, where's the proof, what's my risk, and what exactly do I do next. Watson scores a page on those 7 triggers: Attention, Trust, Clarity, Urgency, Proof, Risk, and Action.
Dashboards can't score any of that. They report behaviour, and behaviour is the symptom, not the cause.
Think of the 7 triggers as switches, because that's how fast a buying brain flips them. The reason this visual matters: every switch below sits in your copy, and not one of them is visible in your analytics.
The neutral data says the same thing. When Baymard Institute asked US shoppers why they abandoned a checkout, the answers were almost never about the product: 39% named surprise extra costs, 19% didn't trust the site with their card, 19% refused a forced account. Those aren't analytics problems. They're trust, clarity, and risk problems: the exact triggers a dashboard can't score. Across Baymard's meta-analysis of 50 studies, 70.22% of carts get abandoned. The leak is enormous, and it's mostly a persuasion leak.
Here are those causes mapped to the trigger each one breaks. This chart is the whole argument for the WHY-layer in one image:
Why US shoppers abandon a checkout
The Biggest Leaks Are Persuasion Leaks
Not one of these shows up in an analytics dashboard as anything but a lost row.
Source: Baymard Institute, 2025 · multiple answers allowed · trigger mapping: Watson
What Does Watson's $9 Report Include?
The Prime Suspect names the leak costing you the most, first. The rest of the report:
- The Prime Suspect: your single costliest leak, called out on page one
- All 7 triggers scored, hit or flagged
- Issues Found: every leak, ranked, each with its fix
- Watson's Notes: what to change first, and why
- Next Step: your clearest next move, named
Setup takes about 2 minutes inside Claude (guide included), and the report lands in about 10 minutes. Watson reads pages that sell: homepages, landing pages, sales pages, offer pages.
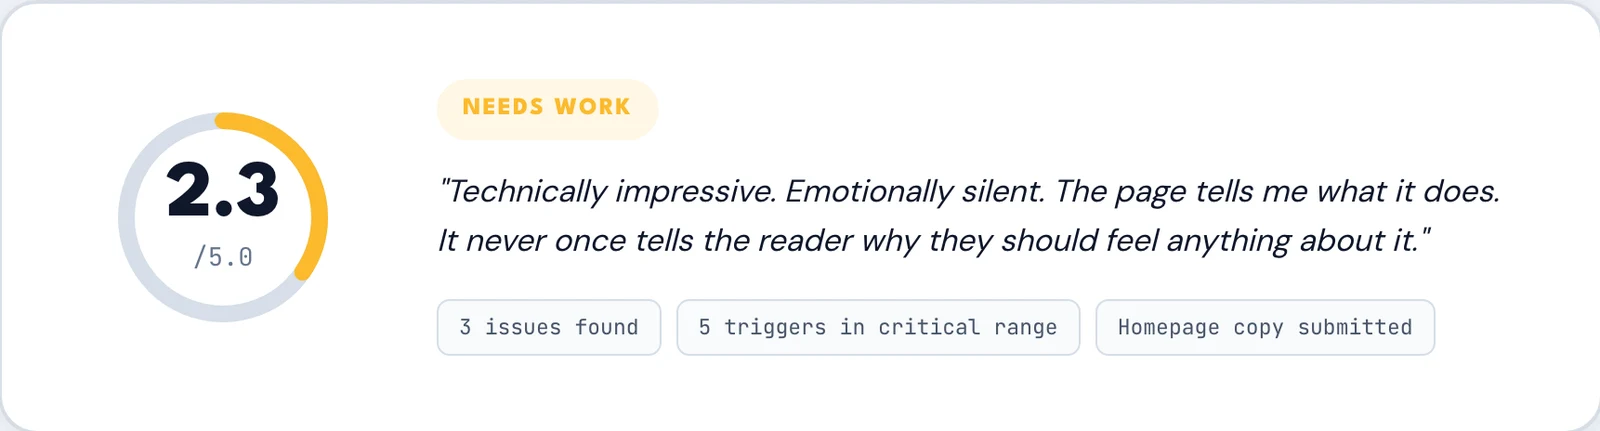
This isn't a mockup. Here's the scorecard from a real Watson case we published on our public report dashboard: a technically strong homepage that still scored 2.3 out of 5, because "the page tells me what it does. It never once tells the reader why they should feel anything about it."
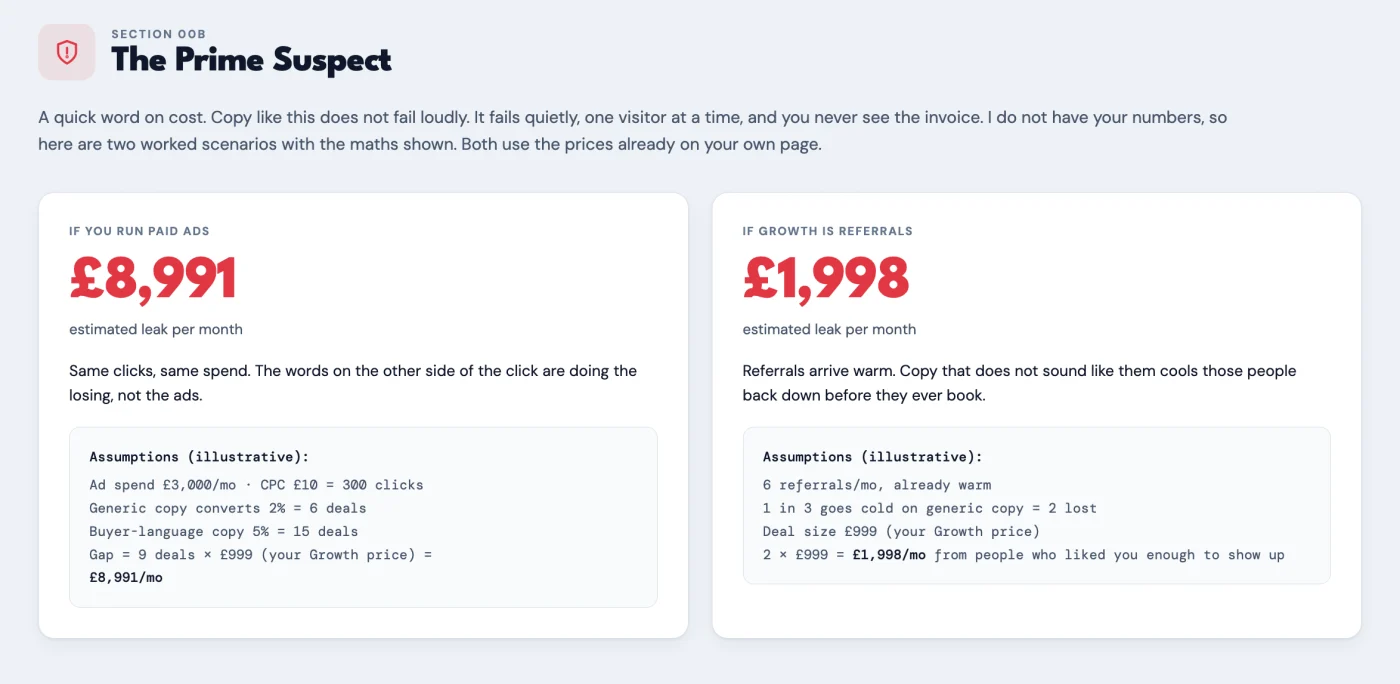
And this is why the ranked list matters more than the score. The same report's Prime Suspect section puts a monthly number on the leak, using the prices already on the client's own page. That's the difference between "your copy could be better" and "these words are costing you about £8,991 a month":
Anton, founder of MVP Gurus: "It's done what would take hours and an expert to do." And: "The price point is nothing compared to the value." Vanjo, founder of Wolkk: "It described our buyers better than we could ourselves."
And the edge case: if all 7 triggers score well and sales still stall, your problem is upstream of copy, in the offer or the audience. Watson telling you that plainly is worth the $9 by itself, because it stops a month of polishing the wrong thing.
The guarantee, exactly as published: "Try it without risk. Run all 5 tools once each. If you don't find a single thing worth changing in your marketing, reply to your receipt and get the $9 back."
What If You Don't Have Enough Traffic for A/B Tests?
Below meaningful volume, testing-first is a coin flip you can't even score.
The listicles quietly assume you have traffic to burn. Most sites don't. A split test on 900 visits a month produces noise with a dashboard attached, and the significance calculator will cheerfully tell you your test needs eleven months.
Here's the number the tool lists never print. A 2022 ACM conference paper co-authored by experimentation leads at Airbnb, Microsoft and Booking.com compiled the published success rates of A/B tests: roughly 33% at Microsoft, 15% at Bing, about 10% at Booking.com, Google Ads and Netflix, and 8% for Airbnb search (A/B Testing Intuition Busters). Those are the winners' numbers, at companies with oceans of traffic and full-time experimentation teams. Most of their ideas still lose.
Look at how much of each track stays empty. The empty space is the point of this chart:
Share of A/B tests that actually win
Even the Giants Lose Most of Their Tests
8% to 33% win, with oceans of traffic. Below that volume, diagnose before you test.
Source: A/B Testing Intuition Busters, ACM KDD '22 · full track = 100% of tests run
So run the low-traffic play instead, in order:
- Diagnose: score the page against the 7 buying triggers and get the leaks ranked
- Fix: change the costliest leak only, and resist redesigning everything at once
- Re-audit: run the same page again and compare scores
- Repeat until the ranked list runs dry, and only then ask whether a testing platform earns a monthly fee
If you're not ready to spend anything, start with Lestrade, the free intake interviewer: it's the $0 door into the same agency, unlimited.
How Do You Compare CRO Tools and Platforms?
Compare tools by job and total monthly cost, not by feature count. Six checks, in order:
- Job coverage: which of the 5 jobs does it do? A second heatmap tool adds nothing.
- Real price: is pricing published? Treat "custom pricing" as an answer in itself if you're budget-led.
- Traffic requirement: does the tool need volume you don't have? (Every testing platform does.)
- Time to insight: minutes, or a quarter of setup and tagging?
- Team fit: who reads the output, and will they act on it?
- Exit cost: monthly contract you can leave, or an annual lock-in with your data inside?
Then total the bill. From the prices published across this SERP's own guides:
| Stack | Layers covered | Monthly total | First-year total |
|---|---|---|---|
| Typical mid-market stack (paid heatmaps + survey tool + testing platform) | Watch, ask, compare | ~$150 to $600+ | ~$1,800 to $7,200+ |
| Starter stack (GA4 + Microsoft Clarity + Watson) | Measure, watch, diagnose | $0/mo | $9 once |
The point isn't that paid suites are wrong. It's that the $9 diagnosis tells you which of them, if any, your evidence actually calls for.
First-year cost of covering the jobs
One of These Bars Is $9
The pink bar is drawn 40x too wide so you can see it at all. That's the point.
Typical stack: prices published across this search's page-one guides · starter: GA4 + Microsoft Clarity + Watson
Here's the checklist working on a real decision. Say you run a service business at 8,000 visits a month and you're weighing a $219/mo session-replay plan. Job coverage: you'd be buying "watch" a second time, since Microsoft Clarity already covers it free. Traffic requirement: fine. Time to insight: you already have recordings you haven't watched. Verdict from your own answers: the money isn't the problem, the missing WHY-layer is. That's the decision this table exists to force, and it usually takes about five minutes.
Is Your AI-Written Page Costing You Sales?
AI copy fails on the evidence side, not the prompt side.
A real buyer on Quora put it in one line: "If your prompt sounds generic, your marketing comes out sounding like a motivational LinkedIn post written by a toaster."
If you wrote your page with AI, you know the loop. The page reads fine. Fine gets scrolled past. And because you can't see which line is losing the sale, you keep polishing all of them. So you buy a prompt pack, switch tools, run a humanizer pass. All three are prompt-side fixes, and the problem is on the evidence side: the model had to guess your buyers' words, and it filled the gap with the same phrases it hands everyone else.
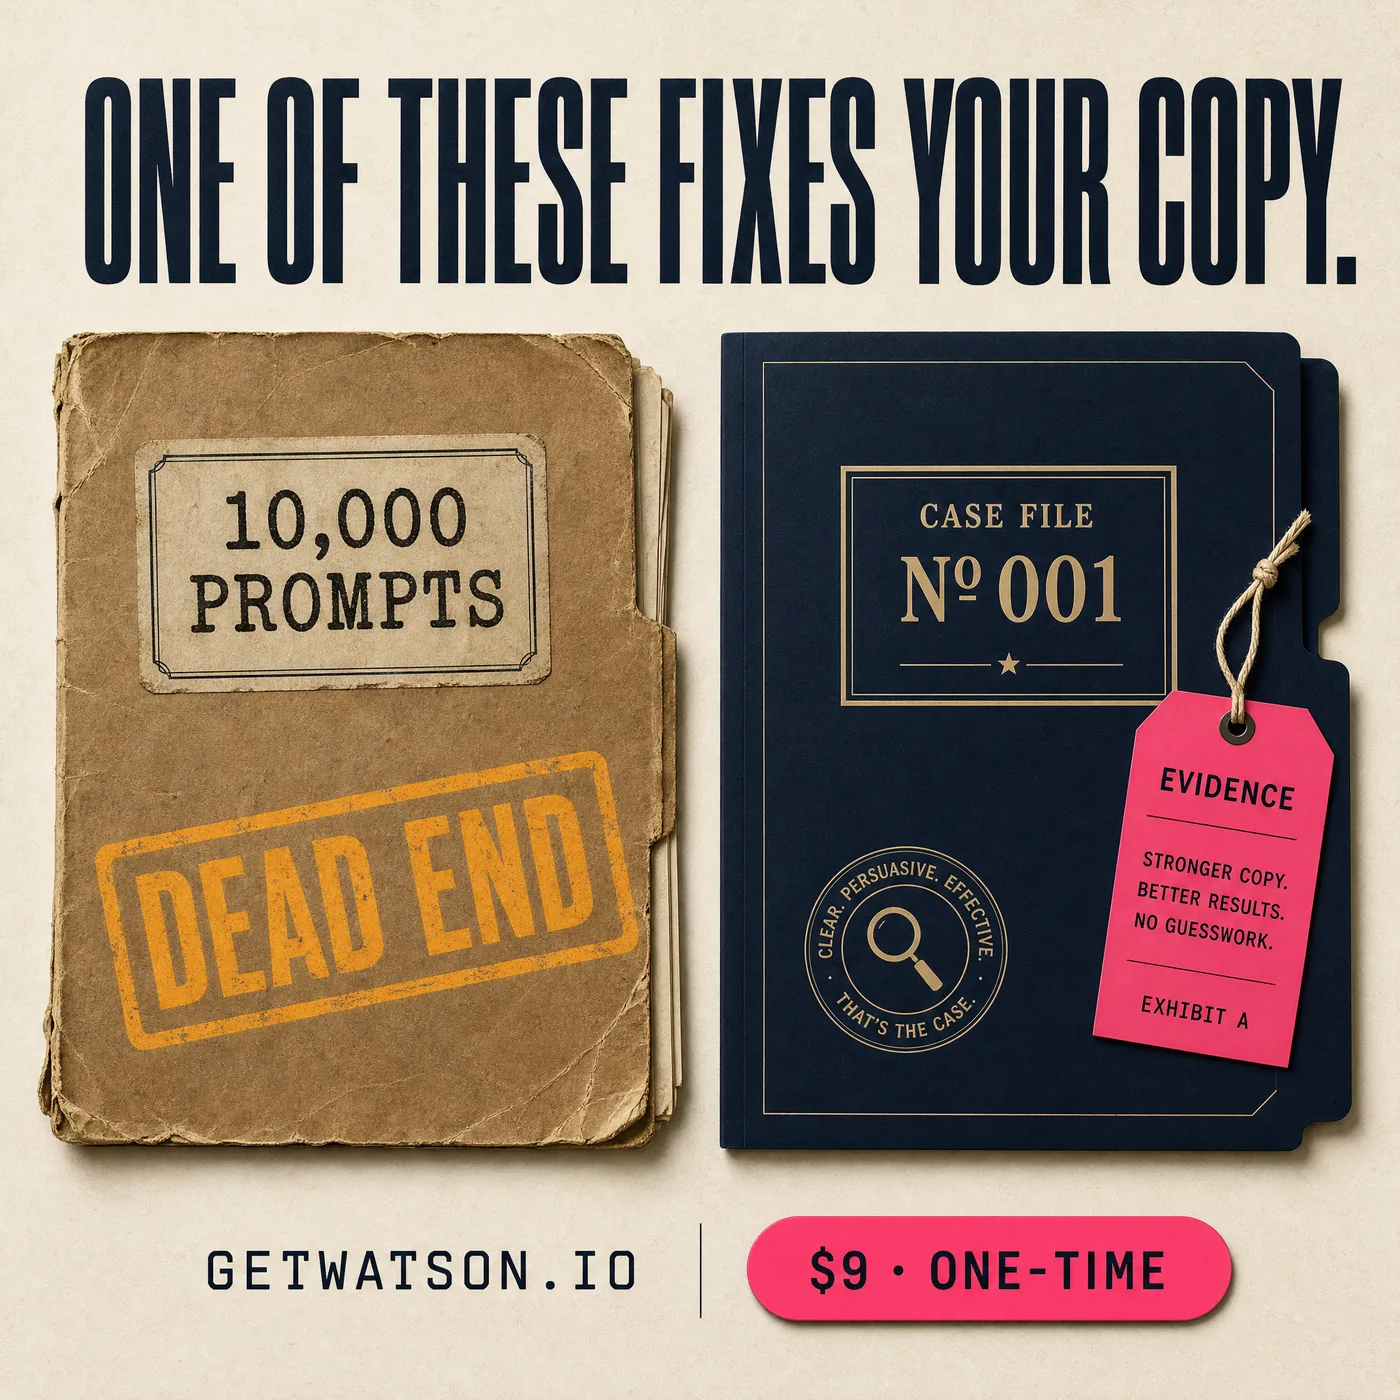
It's not your prompts. It's missing evidence.
We made this visual for exactly this moment of the argument. The folder on the left is where most founders are right now; the case file on the right is the evidence-side alternative this whole guide has been building to:
Readers feel the gap even when they can't name it. Pew Research Center's September 2025 survey of 5,023 US adults found 76% say it's important to be able to tell whether content was made by AI or people, and 53% aren't confident they can. Your buyers may not name the toaster voice. They still bounce off it.
The fix order is diagnosis, then evidence: score which triggers the guessing broke, then rewrite those lines with your buyers' real words instead of a better prompt.
What Comes After the Diagnosis?
Fix the costliest leak first. Then make the traffic yours.
The report gives you a ranked list. Work it top-down, one change at a time, and re-audit the same page after each fix so you can see the score move instead of guessing. If the page you fixed is a campaign page, the landing page audit walkthrough covers the re-check routine; for the site's core pages, use the website copy audit.
Then go get the durable lift: real buyer language. Peer-reviewed research in the Journal of Consumer Research found that when companies speak to customers in concrete, specific language, satisfaction rises 9% and actual spending rises at least 13%. Concrete words are exactly what buyer-language research digs up. The evidence board below is how we think about that research: every card pinned around the centre is a real phrase from a real buyer, and the copy that converts is assembled from those cards, not from a prompt. We put that exact approach through a live ad account in our message testing case study: cost per conversion fell 49.3% after the ads were rebuilt in buyer words.
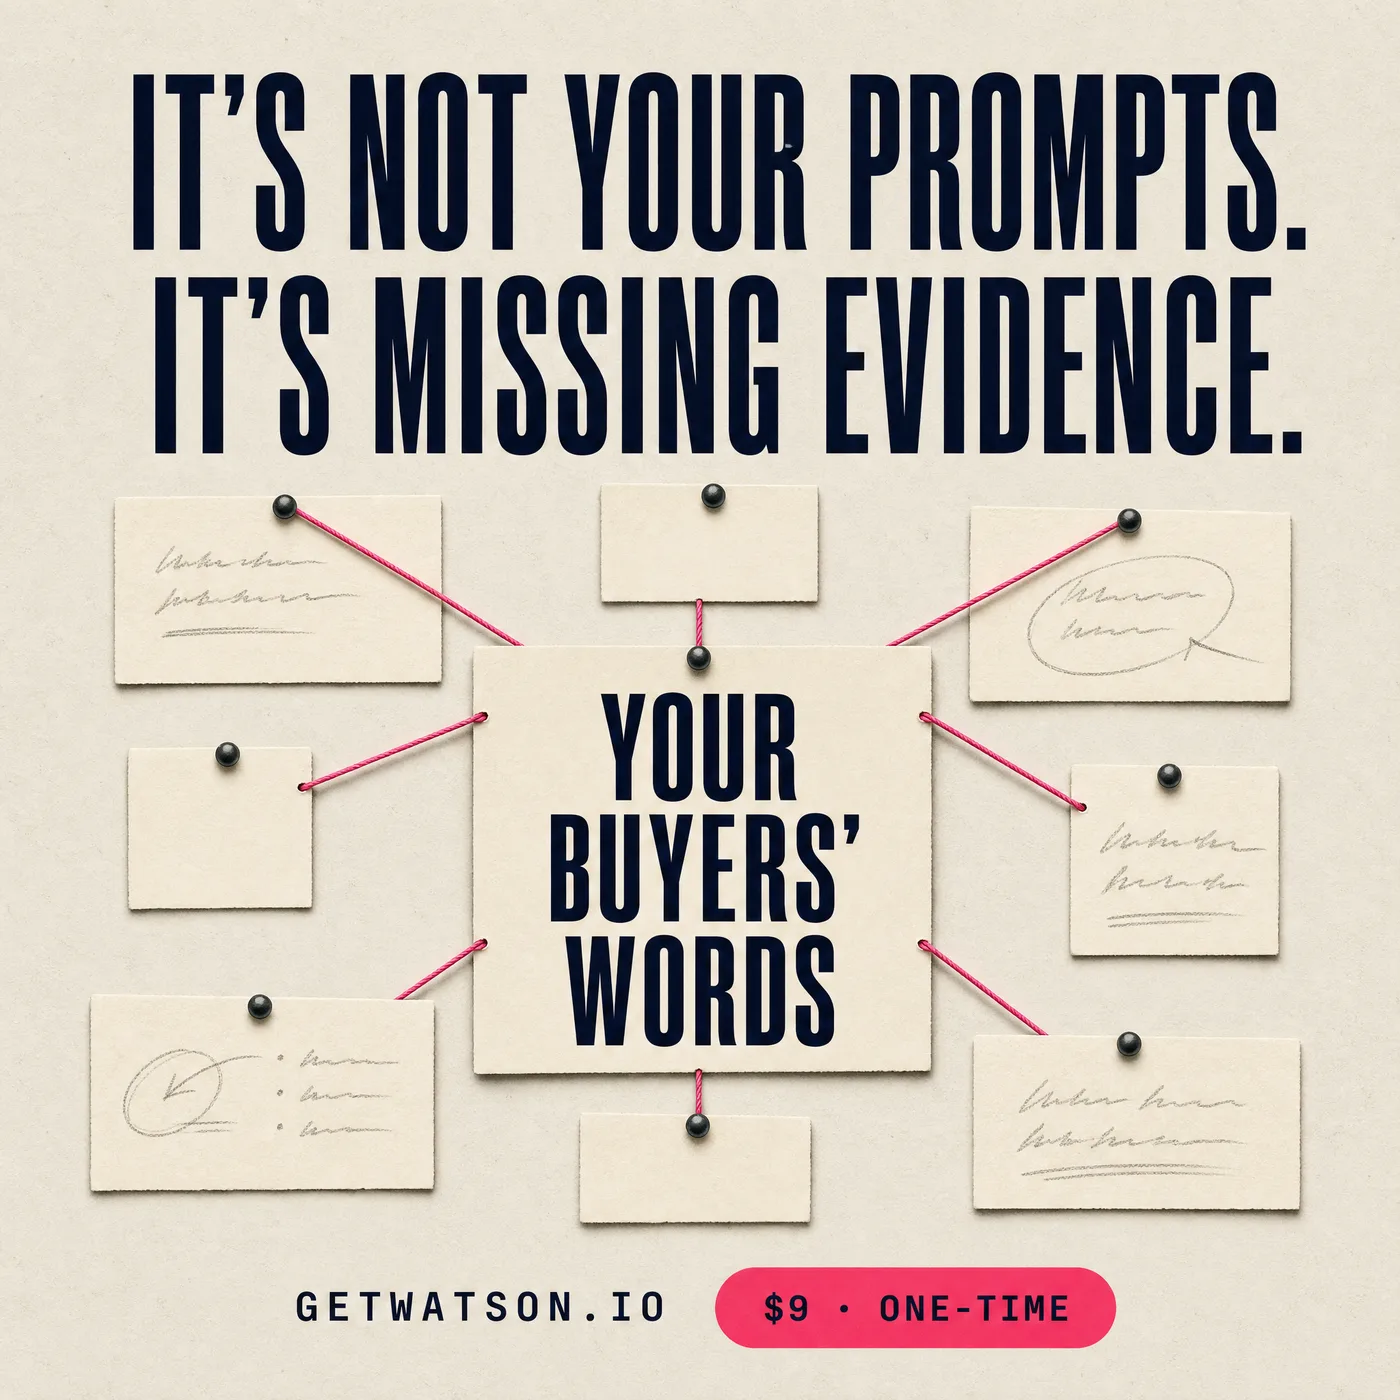 That's Sherlock's job: the Customer DNA report, a full psychological profile of your real buyers built from their own words. Your $9 Watson purchase includes one full Sherlock run, so you can see the depth before you commit to anything.
One last discipline, from our own published casework. Between 2021 and 2025, justinwelsh.me grew its organic search traffic about 480 times, then lost roughly 94% of it in six months after Google's December 2025 and March 2026 core updates. We pulled the Semrush series and wrote the full autopsy (there's a short version too). The lesson for tool buyers: rented traffic gets recalled, owned audience compounds. Whatever your stack, put an email capture on the page you just improved.
Want the Leaks Ranked for You? Run Watson Today
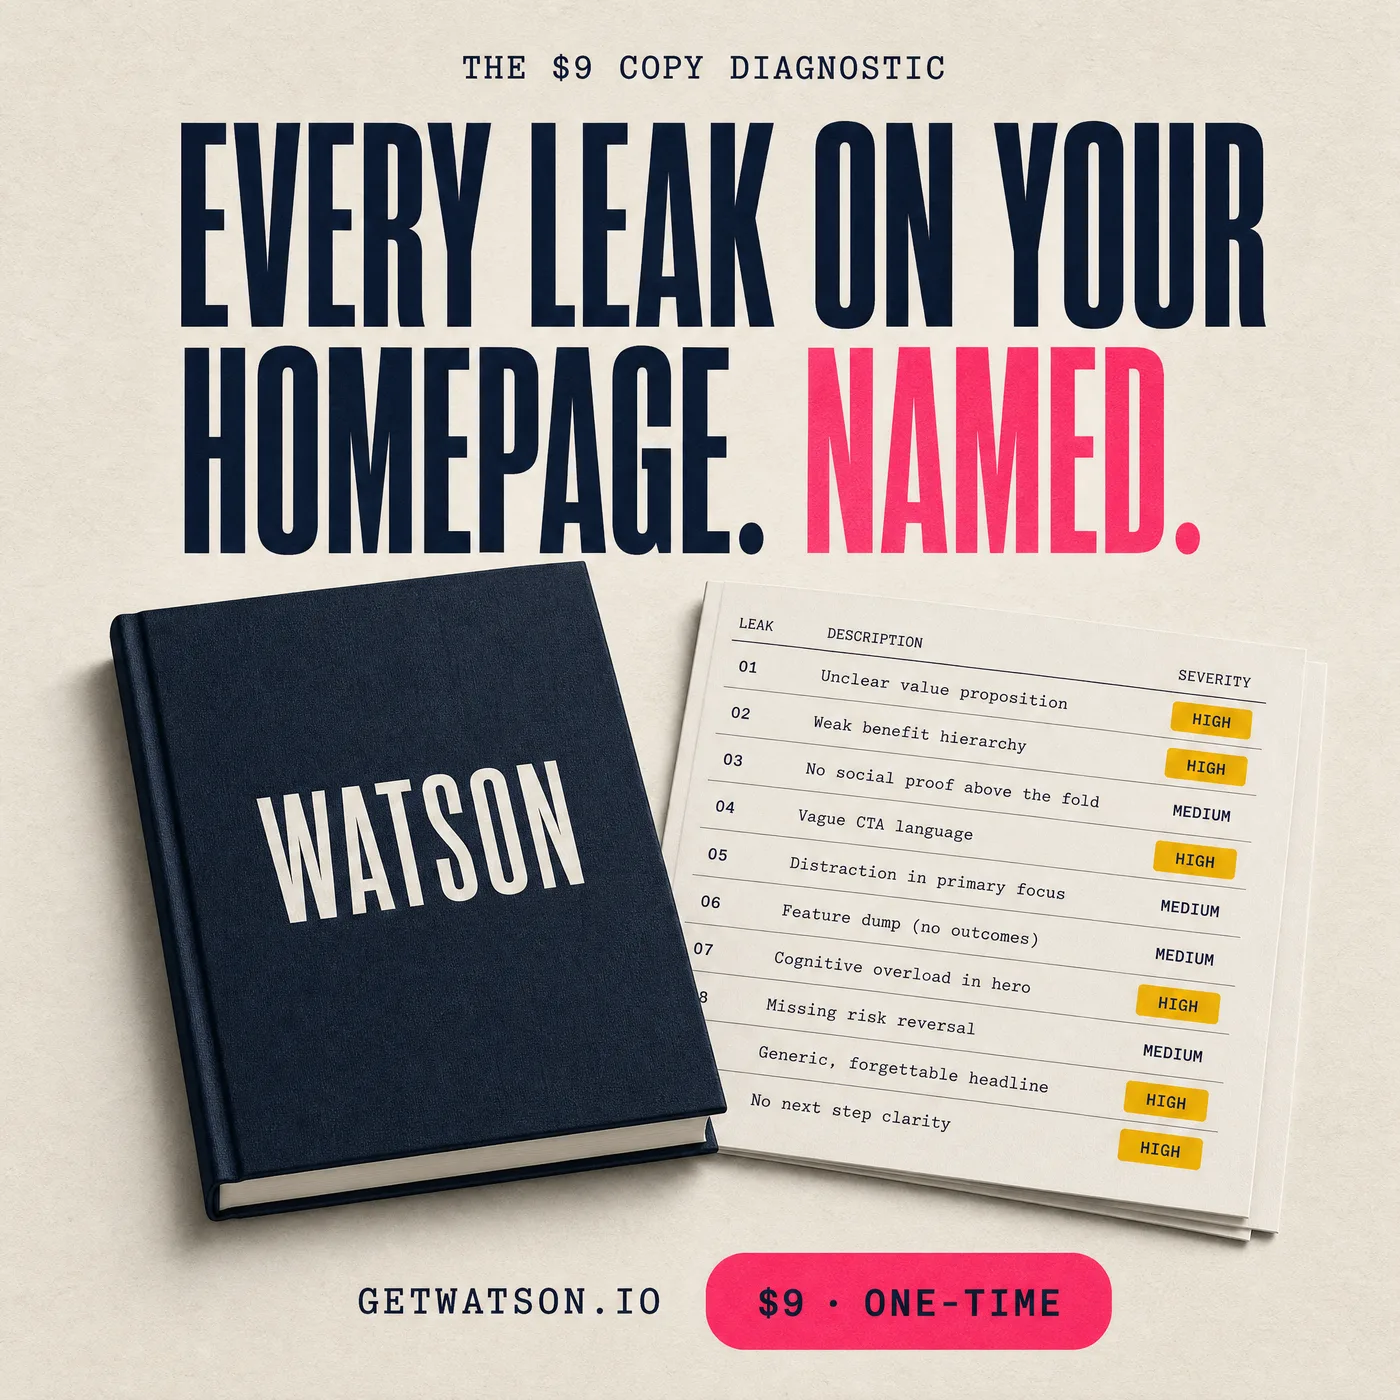
This is the promise in one image, and it's the same list format you saw in the real report above: every leak on the page, named, with a severity next to it.
Optimising a page nobody finds yet? Start one step earlier: bottom of funnel keywords finds the terms that carry buy intent, high converting keywords shows how to prove which ones convert for you with Search Console and GA4, and 50 search optimization tips for 2026 gets the page ranking. Then come back here for the conversion stack.
Want the follow-up work too? We send case studies like this one, AI marketing that converts, and SEO that converts better, to the list. Browse our writing or sign up right here:
Frequently Asked Questions
What Is a Conversion Rate Optimization Tool?
Software that raises the share of visitors who act (buy, sign up, book). Two sides:
- WHERE-tools locate the leak: analytics, heatmaps, session replays, A/B tests
- WHY-tools explain it: buyer research and copy diagnosis
- Most stacks own WHERE and skip WHY
Note: a stack with both sides turns dashboards into decisions.
How Do You Compare CRO Tools and Platforms?
Compare on six axes, in this order:
- Job coverage: which of the 5 jobs it does
- Real published price, and the traffic it needs to be useful
- Time to insight
- Team fit and exit cost
However: treat hidden "custom pricing" as an answer in itself when you're budget-led.
Are There Free CRO Tools That Are Actually Good?
Yes, two cover the WHERE-side at $0:
- Google Analytics 4 measures where visitors come from and drop off
- Microsoft Clarity gives free heatmaps and session recordings
- Lestrade, the intake interviewer in Watson's agency, stays free and unlimited
Note: the WHY-side diagnosis is the layer free analytics can't give you.
Is Watson a Subscription, and What if It Tells Me Nothing New?
No subscription: Watson is $9, one time. The guarantee, exactly as published: "Try it without risk. Run all 5 tools once each. If you don't find a single thing worth changing in your marketing, reply to your receipt and get the $9 back."
What Kinds of Pages Can Watson Read?
Pages that sell:
- Homepages and landing pages
- Sales pages and offer pages
- Report in about 10 minutes; setup about 2 minutes in Claude, guide included
However: blogs and docs aren't Watson's job; use the bundled Google Quality Rater run for content.
When Is Sherlock Worth It After Watson?
When the diagnosis shows trigger failures that need real buyer language to fix (Trust, Proof, Clarity). Sherlock builds the Customer DNA report: the full psychological profile of your real buyers. Your $9 Watson purchase includes one full Sherlock run, so you can preview the depth.
What About A/B Testing Automation Tools?
Useful once volume supports them. Context first:
- Published success rates at Microsoft, Bing, Booking.com, Netflix and Airbnb run 8% to 33%
- Small-sample tests produce noise, not winners
- Diagnose and fix ranked leaks first; test when traffic can call a winner
Sources
- Google and Deloitte: Milliseconds Make Millions (0.1-second mobile speed improvement, 8.4% retail conversion lift)
- Baymard Institute: Cart Abandonment Rate Statistics (meta-analysis of 50 studies, 70.22% average abandonment)
- ExP Platform: A/B Testing Intuition Busters (ACM KDD 2022 paper, published test success rates at Microsoft, Bing, Booking.com, Netflix and Airbnb)
- Pew Research Center: How Americans View AI and Its Impact on People and Society (survey of 5,023 US adults, 17 September 2025)
- Journal of Consumer Research: How Concrete Language Shapes Customer Satisfaction (peer-reviewed, 9% satisfaction and 13% spending lift)